
Delivery Timeline Tracking Examples for Project Managers



TL;DR:
- Delivery timeline tracking monitors project or shipment progress using visual tools and standardized indicators. Project managers see better predictability and fewer surprises when applying structured tracking methods like phase-gate charts and real-time map updates. Using clear visual states, normalized status codes, and separate workstream timelines improves transparency and decision-making efficiency.
Delivery timeline tracking is the process of monitoring project or shipment progress using visual timelines, real-time status updates, and standardized indicators to keep work on schedule and stakeholders informed. Project managers who apply structured delivery timeline examples consistently report better predictability and fewer last-minute surprises. The methods range from phase-gate milestone charts to live map-based tracking, and the right choice depends on your project’s complexity and team structure. This guide covers the most effective examples of delivery timeline tracking so you can pick the approach that fits your workflow.
1. What are the best examples of delivery timeline tracking methods?
Phase-gate timelines are the most widely used structure for complex project delivery. A typical 16-week cycle covers Discovery, Planning, Development, QA, and Deployment, with hard milestones like design approval at week 5 and UAT sign-off at week 14. Each gate acts as a checkpoint. Work cannot advance until the previous phase meets its criteria.
Real-time map-based tracking is the standard for logistics and field delivery. Live tracking with map integration can increase checkout conversions by 20%. That number reflects how much customers and stakeholders value knowing exactly where a delivery stands at any moment.

Standardized status codes give every team member the same vocabulary. Codes like accepted, in_transit, delivered, and exception remove ambiguity from status updates. Visual stepper timelines translate those backend codes into user-friendly states that non-technical stakeholders can read at a glance.
The four most effective tracking methods for project managers are:
- Phase-gate milestone charts for multi-phase software or product delivery
- Real-time map timelines for logistics, field service, or physical shipments
- Stepper progress indicators for customer-facing or stakeholder-facing status views
- Standardized status code dashboards for internal operations and cross-team reporting
Pro Tip: Combine a phase-gate chart for internal planning with a stepper timeline for stakeholder communication. Each audience gets the level of detail they actually need.
2. How can project managers visualize delivery timelines effectively?
Step-based progress indicators, called steppers, are the clearest way to show delivery status. Normalized step states like done, current, todo, and failed give users immediate context without requiring them to interpret raw database values. A step marked “current” tells a stakeholder exactly where the work stands. A step marked “failed” triggers action without any explanation needed.
Tooltips and detail panels add depth without cluttering the main view. When a stakeholder clicks or hovers on a milestone, they see the exact timestamp, the responsible team, and any notes attached to that event. This keeps the primary timeline clean while preserving the audit trail.
Parallel tracks handle split shipments or multi-team workflows. If two teams are delivering separate components of the same project, separate visual timelines prevent confusion about which status belongs to which workstream. Merging them into one timeline creates ambiguity that slows decisions.
Best practices for timeline visualization include:
- Use four states maximum at the step level: done, current, todo, and failed
- Show timestamps in tooltips, not on the main timeline bar
- Separate parallel workstreams into distinct visual rows
- Label milestones with plain language, not internal codes
Pro Tip: When presenting timelines to executives or clients, hide the granular task-level steps and show only phase milestones. Fewer data points mean faster decisions.
3. What role does standardized status coding play in delivery timeline tracking?
Standardized status codes are the backbone of any tracking system that scales. Using codes like accepted, in_transit, delivered, and exception reduces manual inquiries and automates workflow triggers. When a shipment hits exception, the system can automatically notify the responsible team without anyone manually checking a dashboard.
Mapping backend events to frontend states is where most teams lose consistency. A carrier might send 12 different raw status strings for what is functionally the same state: “in transit.” Normalizing those strings to a single in_transit code means your timeline always shows one consistent label, regardless of which carrier or team generated the event.
The benefits for cross-team communication are direct. Operations, customer success, and leadership all read the same status label. There is no translation layer between what the logistics team sees and what the account manager reports to the client.
Key status codes every delivery tracking system should include:
accepted: order or task received and confirmedin_transit: actively moving toward completion or deliveryout_for_delivery: final leg before completiondelivered: confirmed completeexception: delay, failure, or intervention required
4. Which tools and techniques optimize real-time tracking performance?
Real-time tracking generates a high volume of location or status events. Without throttling, those events overwhelm APIs and inflate infrastructure costs. Haversine distance throttling solves this by only triggering a UI update when a delivery has moved a meaningful distance. The system ignores micro-movements and updates the timeline only when the position change is significant.
WebSocket connections and push notifications keep timelines current without requiring users to refresh. A WebSocket holds an open connection between the server and the client. When a new status event fires, the update appears on the timeline within seconds. This matters most for high-stakes deliveries where a 10-minute delay in status visibility can affect downstream decisions.
Time zone handling is a detail that breaks international tracking when ignored. Timezone switchers let users toggle between local scan time, origin timezone, and destination timezone. A package scanned at 11:00 PM in Shanghai looks very different on a timeline when displayed in New York local time. Giving users control over the timezone view eliminates a common source of confusion.
Techniques that keep real-time tracking accurate and cost-effective:
- Haversine distance throttling to reduce unnecessary API calls
- WebSocket or push notification delivery for sub-minute status updates
- Timezone switchers for international shipment or project timelines
- Audit log separation from the user-facing timeline to keep the UI readable
5. How do delivery timeline examples vary by project complexity?
Simple projects need simple tracking. A five-task list with due dates and a status column covers most single-team deliveries. Adding milestone markers, Gantt bars, or phase gates to a simple project creates overhead without adding visibility. The tracking method should match the actual complexity of the work.
Multi-phase projects require structured timelines with clear milestone differentiation. Software delivery timelines typically run through Discovery, Design, Development, QA, and Launch phases. Logistics shipment timelines run through Order Confirmed, Picked, Packed, Shipped, In Transit, and Delivered. Both use the same structural logic but serve very different operational contexts.
The table below shows how tracking approaches differ by project type.
| Project type | Recommended tracking method | Key milestone examples |
|---|---|---|
| Single-team task delivery | Status list with due dates | Task assigned, in progress, complete |
| Multi-phase software project | Phase-gate Gantt with milestones | Design approval, UAT sign-off, go-live |
| Logistics shipment | Real-time map with status codes | Picked, in transit, out for delivery |
| Multi-team parallel delivery | Separate visual timelines per track | Each team’s phase gates tracked independently |
Split shipments and multi-team workflows are the most common source of tracking confusion. When two shipments share one timeline, a delay in one leg looks like a delay in the whole delivery. Separating them into parallel timeline tracks gives each workstream its own visibility without mixing statuses.
Milestones distinguish active task progress from overall delivery progress. A task list shows what is being worked on right now. A milestone marks a point where something meaningful has been completed and verified. Both matter, but conflating them produces timelines that are hard to interpret under pressure.
Key Takeaways
The most effective delivery timeline tracking combines phase-gate milestones, standardized status codes, and normalized visual states to give every stakeholder clear, accurate progress information.
| Point | Details |
|---|---|
| Use phase-gate milestones | Structure complex projects into phases with hard checkpoints to prevent scope drift. |
| Normalize status codes | Map all backend events to consistent labels like in_transit or exception to reduce confusion. |
| Apply stepper visualization | Use done, current, todo, and failed states to make timelines readable for non-technical audiences. |
| Throttle real-time updates | Use distance-based throttling to keep live tracking accurate without inflating infrastructure costs. |
| Separate parallel tracks | Give each workstream its own timeline row to prevent status overlap in multi-team deliveries. |
What I’ve learned from getting delivery timelines wrong
The most common mistake I see project managers make is building one timeline that tries to serve every audience. The operations team needs granular task-level status. Executives need phase milestones. Clients need a simple stepper showing where their delivery stands. Cramming all three into one view produces a timeline that confuses everyone.
Proactive exception management is the real goal of any tracking system. The point is not to record what happened. The point is to flag what is about to go wrong before it does. Most teams I’ve worked with treat tracking as a reporting tool. The teams that actually hit their delivery dates treat it as an early warning system.
Time zones are the silent killer of international project timelines. I’ve watched cross-border teams argue about whether a milestone was hit on time because no one agreed on which timezone the deadline applied to. A simple timezone switcher in your tracking UI eliminates that argument entirely.
My honest recommendation: start with standardized status codes and a stepper visualization. Get those right before adding real-time map integration or complex phase-gate structures. Simplicity in the delivery tracking UI improves comprehension more than any additional feature. Add complexity only when a specific operational need demands it.
— Dima
How Teambuilt supports delivery timeline visibility
Teambuilt gives project managers a centralized view of team capacity, project phases, and delivery forecasts without requiring a separate tracking tool for each workflow.
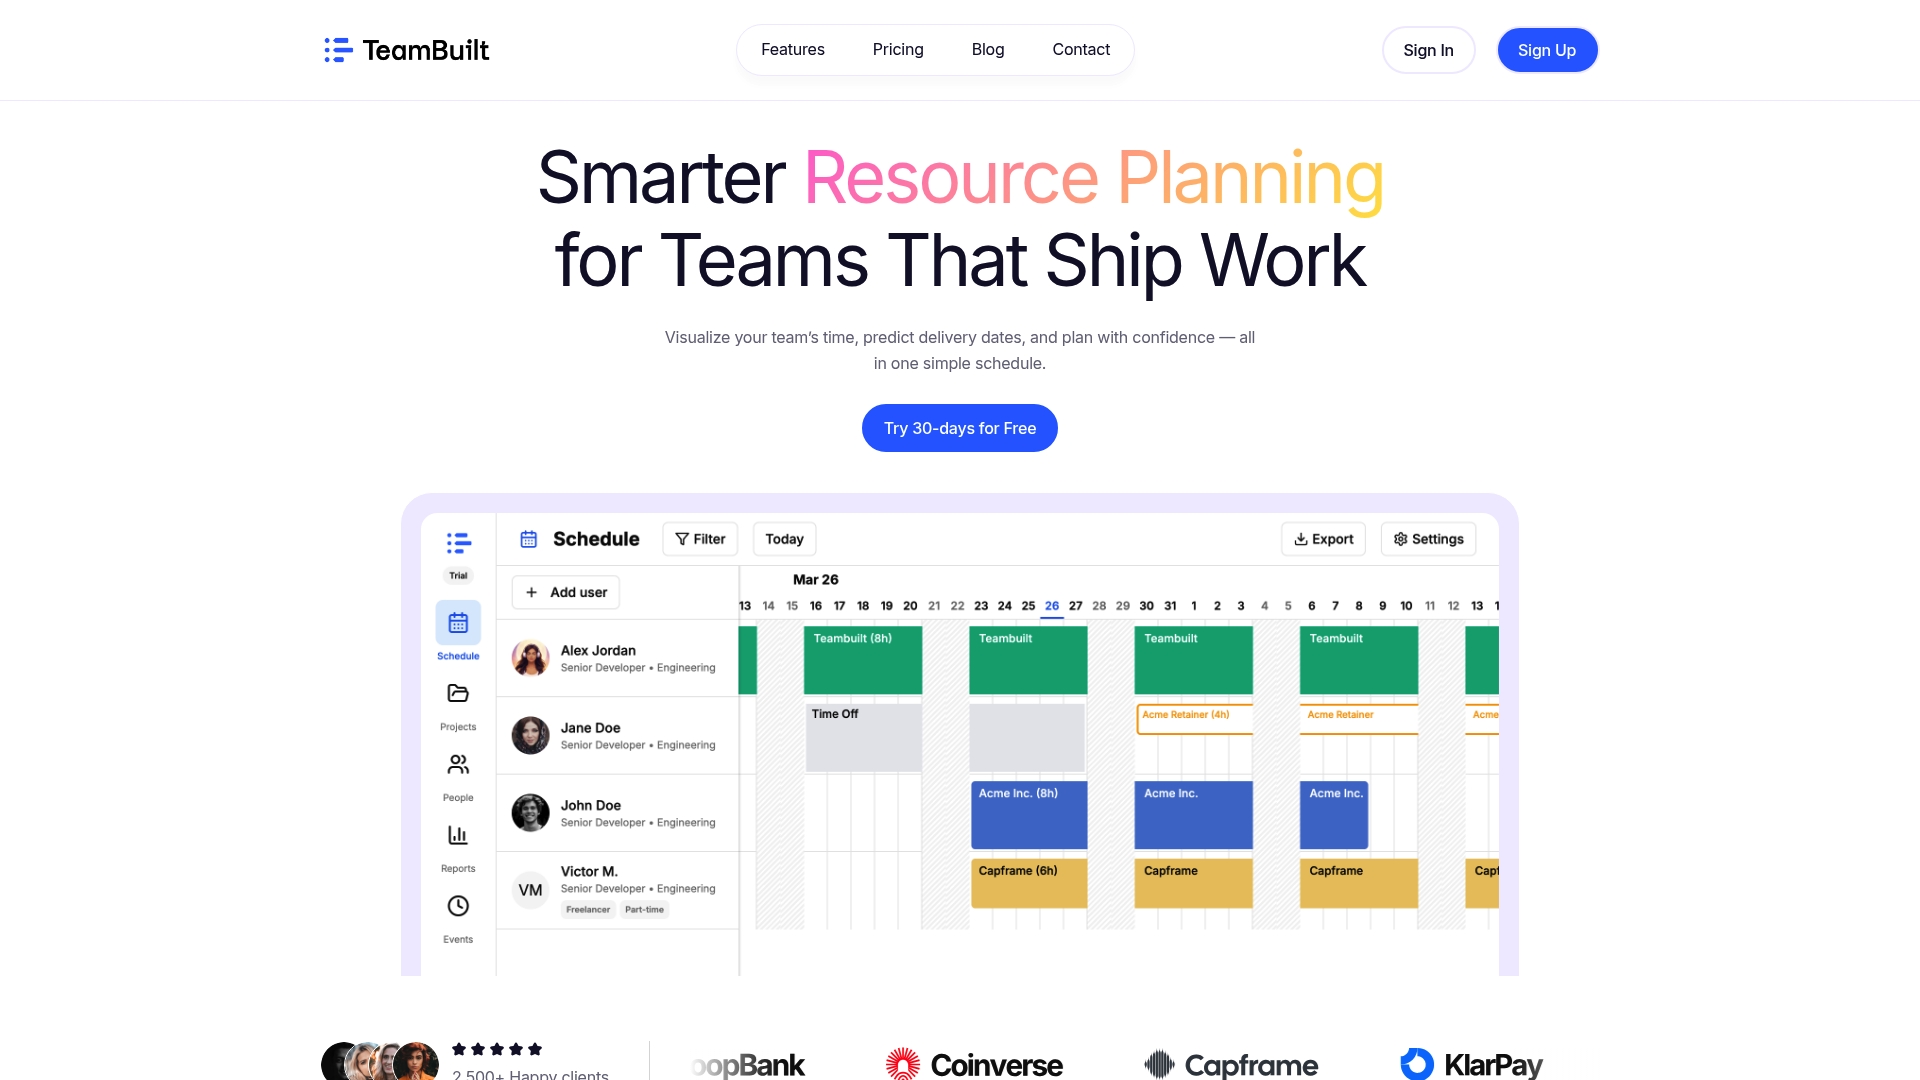
The platform’s timeline visualization connects resource availability to delivery dates, so you can see not just where a project stands but whether the team has the capacity to hit the next milestone on schedule. Teambuilt’s project planning features support phase-gate structures, milestone tracking, and cross-team coordination in one place. For project managers who are replacing spreadsheets and disconnected status updates, it provides the real-time visibility that makes delivery tracking a planning asset rather than a reporting chore.
FAQ
What is delivery timeline tracking?
Delivery timeline tracking is the process of monitoring project or shipment progress using visual timelines, status codes, and milestone markers to confirm on-time completion and flag delays early.
What are the most common examples of shipment tracking statuses?
The most common status codes are accepted, in_transit, out_for_delivery, delivered, and exception. These normalized labels reduce ambiguity and automate workflow triggers across teams.
How do steppers improve delivery timeline visualization?
Steppers use four states, done, current, todo, and failed, to translate raw backend statuses into a format that any stakeholder can read without technical knowledge.
When should a project use multiple parallel timelines?
Use separate timelines when two or more workstreams or shipments run concurrently. Merging them into one view causes status overlap and makes it harder to identify which leg is causing a delay.
How does time zone handling affect delivery tracking accuracy?
Displaying timestamps in the wrong timezone makes milestones appear late or early when they are actually on schedule. Timezone switchers let users view events in local, origin, or destination time to eliminate that confusion.
Recommended