
Engineering Team Bandwidth: 2026 Guide for Leads


TL;DR:
- Engineering team bandwidth reflects the productive hours available after accounting for meetings, administrative tasks, PTO, and unplanned work. Measuring actual throughput using recent sprint data provides a realistic view of capacity, which should be planned at 70–80% to accommodate interruptions and emergencies. Clear capacity allocation, explicit scope negotiation, and real-time visibility tools help prevent overloading teams and improve delivery predictability.
Engineering team bandwidth is defined as the actual productive capacity available for planned project work after subtracting meetings, administrative duties, PTO, on-call rotations, and unplanned incident responses. Most teams assume they have far more capacity than they do. True productive engineering time typically ranges from 50% to 60% of total contracted hours. That gap between assumed and actual capacity is where project plans fall apart. Understanding what is engineering team bandwidth, and measuring it honestly, is the foundation of realistic delivery commitments.
What is engineering team bandwidth and how do you measure it?
Engineering team bandwidth is not headcount multiplied by working hours. That calculation ignores every obligation that pulls engineers away from building features. The industry term for this concept is capacity utilization, and it covers the full picture of where time actually goes.
What consumes capacity beyond feature work:
- Meetings and standups (often 10–15% of the week for senior engineers)
- Administrative tasks, documentation, and code reviews
- PTO, holidays, and sick days
- On-call rotations and incident response
- Context switching between projects
Unplanned work alone consumes 20–30% of capacity on most teams. That figure means a five-person team effectively loses one full engineer’s output every sprint to fires and interruptions.
Use historical throughput, not theoretical hours
The most reliable way to measure bandwidth is through historical throughput, meaning the actual work delivered per sprint, not the theoretical hours available. Throughput-based planning consistently outperforms theoretical capacity estimates in accuracy. Pull your last six sprints of velocity data. Average the completed story points. That number is your real bandwidth, not the sum of everyone’s calendar hours.
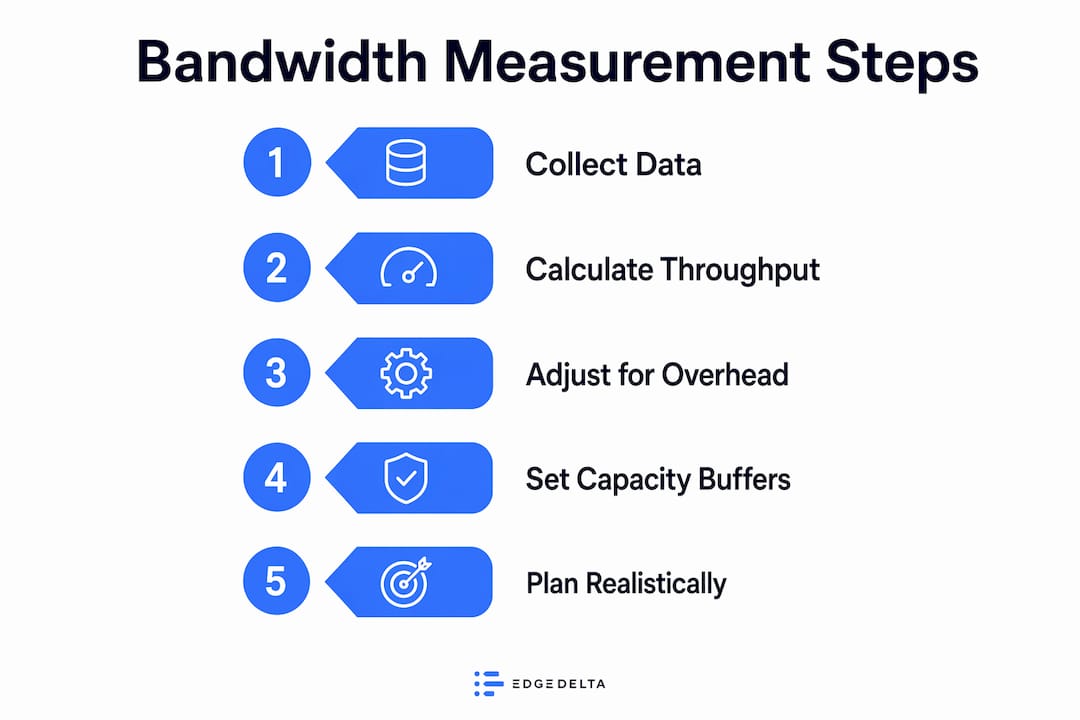
Time audits are another useful tool. Ask engineers to log their time across categories for two weeks using tools like Toggl Track or Clockify. The results almost always reveal that feature work represents less than half of the actual week.
Pro Tip: Never plan to 100% of available hours. Planning to 70–80% of actual available hours accounts for micro-interruptions and unexpected demands that consistently erode planned capacity. Teams using this buffer show 35–40% higher sprint completion rates.
What are the warning signs your team is over bandwidth?
Bandwidth problems rarely announce themselves loudly. They accumulate quietly until a deadline slips or an engineer quits. Recognizing the early signals gives you time to act before delivery suffers.
- Simple tasks slow down. When a one-point ticket takes three days, the team is not lazy. Engineers are context-switching constantly, and each switch costs 20–30 minutes of recovery time.
- Backlogs grow faster than they shrink. A backlog that expands every sprint signals that intake exceeds output. That gap will not close by working harder.
- One or two engineers carry everything. Key-person dependency is a bandwidth symptom. It means work is not distributed, and those individuals are absorbing far more than their share.
- Technical improvements never happen. When there is no time for refactoring, testing infrastructure, or documentation, the team is running at or above capacity with no slack for anything non-urgent.
- Sprint carryover becomes routine. Occasional carryover is normal. Consistent carryover means the team is committing to more than it can deliver every single cycle.
Key metrics to track include cycle time, work-in-progress count, and sprint carryover rate. These numbers reveal stress before it severely impacts delivery. A rising WIP count is particularly telling because it shows the team is starting more work than it finishes.
Teams should reserve a 15–20% buffer specifically for unplanned work and emergencies. Without that buffer, every unexpected incident eats directly into committed feature work. The result is a team that is always behind despite working long hours.
How should you allocate engineering team bandwidth?
Allocation is where bandwidth planning becomes concrete. The goal is to divide available capacity across competing demands in a way that keeps the product moving forward without letting infrastructure decay.

A widely recommended starting model breaks capacity into four buckets. The table below compares common allocation approaches with their trade-offs.
| Allocation Model | Feature Delivery | Reliability/Maintenance | Technical Debt | Team Investment | Best For |
|---|---|---|---|---|---|
| Standard (recommended) | 60% | 15% | 15% | 10% | Established products with moderate debt |
| Growth-focused | 75% | 10% | 10% | 5% | New product builds with clean codebases |
| Debt-heavy recovery | 40% | 15% | 35% | 10% | Legacy systems with high maintenance burden |
| Team-building phase | 55% | 15% | 15% | 15% | Teams onboarding multiple new engineers |
The 60/15/15/10 allocation model balances project delivery with infrastructure health and team growth. It is a starting point, not a fixed rule. A team maintaining a five-year-old monolith needs more debt reduction capacity than a team building a greenfield service.
The most important discipline is making these allocations explicit. When capacity buckets are invisible, feature requests always win. Reliability work and technical debt reduction get squeezed out because they lack visible advocates in sprint planning meetings.
Pro Tip: Use your allocation data in roadmap conversations. When a stakeholder requests an additional feature, show them which bucket it comes from and what gets delayed. That transparency shifts the conversation from “can you fit this in?” to “what are we willing to trade?”
Protecting the team investment bucket matters more than most leads realize. That 10% covers onboarding, learning, internal tooling improvements, and documentation. Teams that cut it first when under pressure pay the cost later in slower ramp times and higher turnover. For more on managing team workload without burning out engineers, the principles are the same: protect the slack, or it disappears.
Best practices for managing engineering team bandwidth in 2026
Knowing your bandwidth number is only useful if you act on it. These practices turn measurement into better delivery.
Build your plan from real data:
- Pull the last six sprints of velocity. Use the average, not the best sprint, as your planning baseline.
- Account for every meeting, review cycle, and recurring obligation before committing to sprint scope.
- Track the ratio of planned to unplanned work over time. If unplanned work consistently runs at 25%, that number belongs in every future forecast.
Protect capacity through visibility:
- Make WIP limits explicit in your sprint board. A team of six should rarely have more than eight active tickets at once.
- Review cycle time and sprint carryover every two weeks. Trends matter more than single data points.
- Use tools like Teambuilt, Linear, or Jira to surface utilization data in real time rather than reconstructing it after a sprint fails.
Negotiate scope, not capacity:
- When a new urgent request arrives mid-sprint, do not absorb it silently. Show the requester what gets pushed.
- Capacity is finite. Adding more requests beyond limits causes delayed deliveries, technical debt, and burnout rather than more output.
- Consider staff augmentation or offshore capacity expansion only after you have resolved process and ownership issues. Hiring into a broken system adds cost without fixing throughput.
Pro Tip: Treat capacity as a fixed constraint, not a negotiable target. When stakeholders push for more, the answer is not “we’ll try.” The answer is “here is what we can deliver, and here is what we need to defer.” That clarity builds more trust than optimistic commitments that miss.
For a structured approach to capacity planning strategies that improve agile delivery, the mechanics of throughput measurement and sprint forecasting are worth studying in depth.
Key takeaways
Engineering team bandwidth is the actual productive hours available after overhead, and planning to 70–80% of that number is the single most effective way to improve sprint completion rates and delivery predictability.
| Point | Details |
|---|---|
| Bandwidth is not headcount times hours | True productive time runs 50–60% of contracted hours after meetings, PTO, and unplanned work. |
| Measure with throughput, not theory | Use average sprint velocity from the last six sprints as your real planning baseline. |
| Reserve a 15–20% buffer | Protect capacity for unplanned work and emergencies before committing to feature scope. |
| Allocate explicitly across four buckets | Divide capacity into features, reliability, technical debt, and team investment to prevent invisible squeeze. |
| Negotiate scope, not capacity | When new requests arrive, show the trade-off rather than silently absorbing more work. |
Capacity is physics. stop treating it like a suggestion.
The most persistent mistake I see engineering leads make is treating capacity as a starting point for negotiation rather than a hard constraint. A stakeholder asks for three more features this sprint, and the lead says “we’ll see what we can do.” That answer feels collaborative. It is actually a setup for failure.
Exceeding capacity leads to spillage that shows up as technical debt, burnout, and brittle systems. Every time a team absorbs more than it can handle, it borrows against future capacity. The debt compounds.
What actually builds credibility with stakeholders is not saying yes to everything. It is showing up with data. When you can say “our last six sprints averaged 42 story points, we have three engineers at full availability this sprint, and we have already allocated 15% to reliability work, so we can commit to 28 points of feature work,” that is a conversation that earns respect. Gut-feel commitments do not.
The buffer is not laziness. It is the space where learning happens, where engineers fix the thing that has been bothering them for months, and where the team absorbs a production incident without a death march. Protect it like a budget line, because it is one.
— Dima
See your team’s real capacity with Teambuilt
Understanding bandwidth in theory is one thing. Seeing it in real time across your whole team is where the real gains come from.
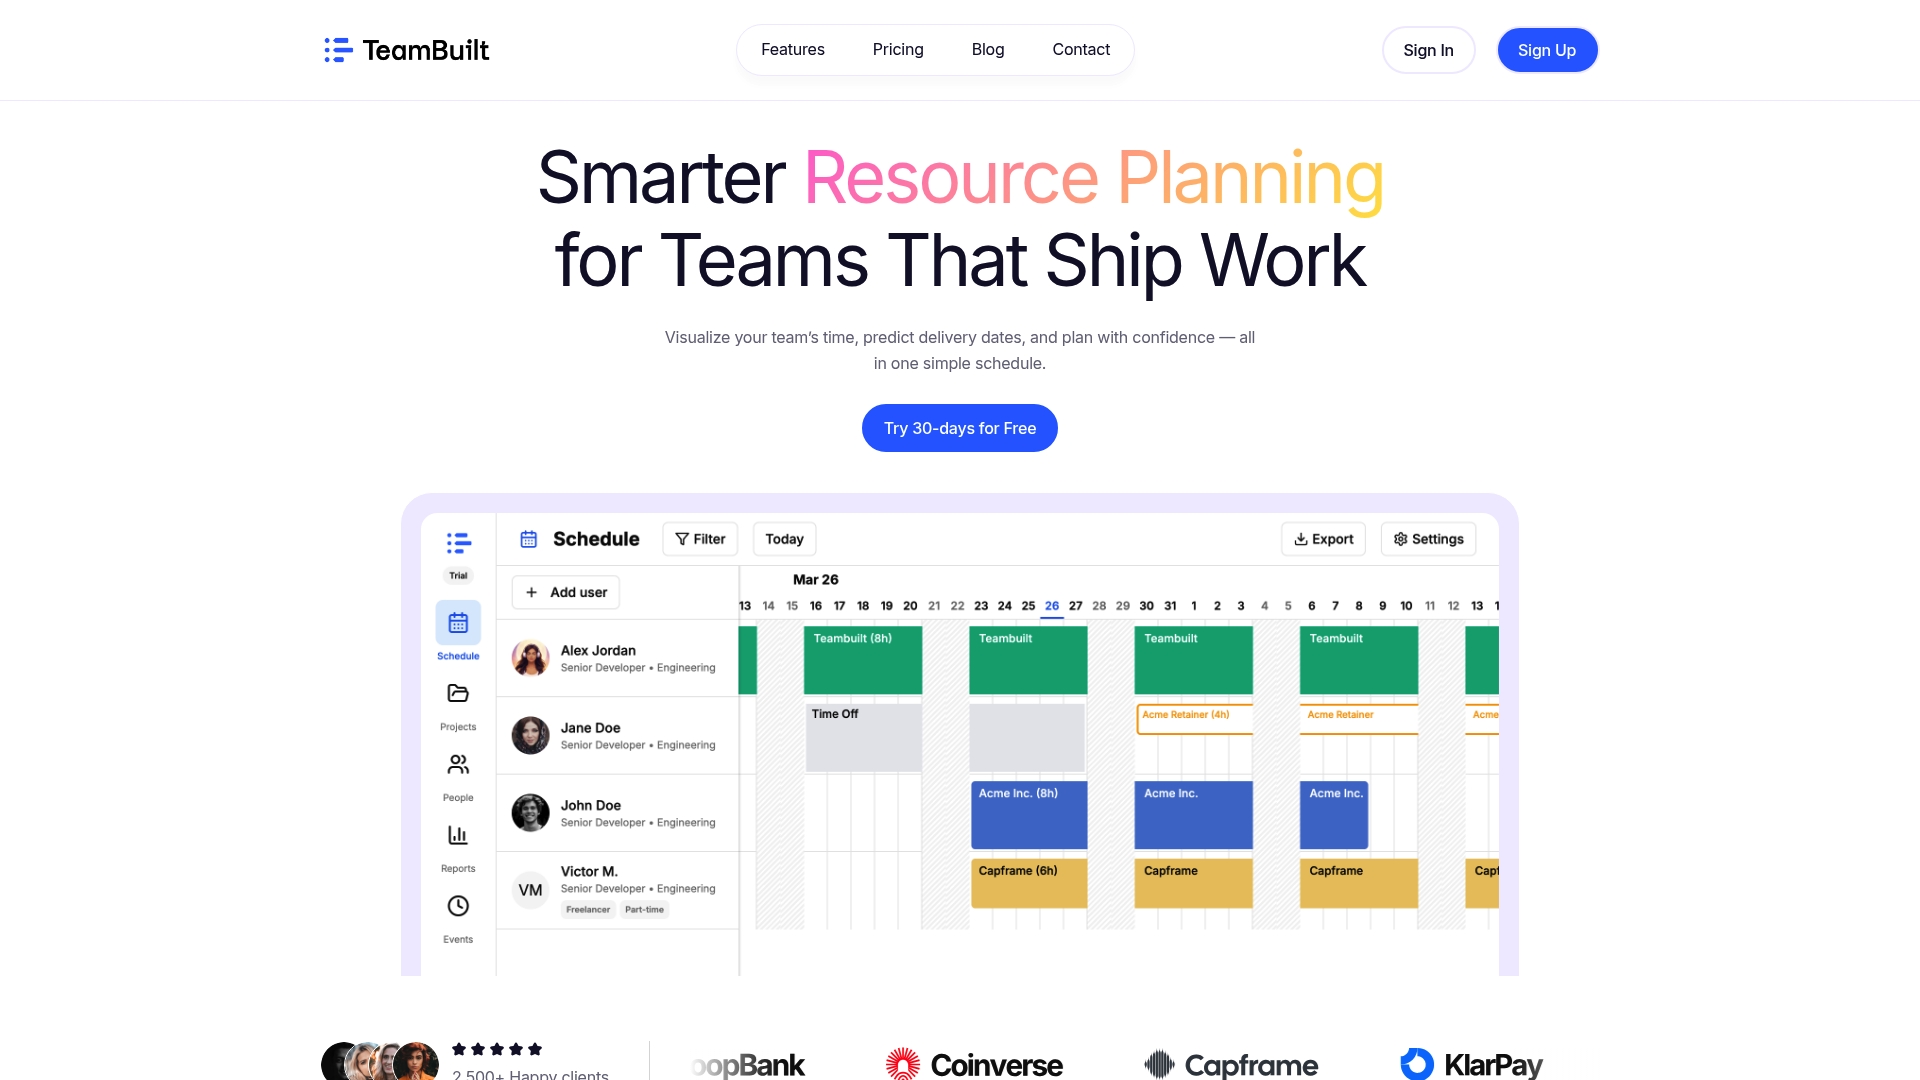
Teambuilt gives project managers and engineering leads a live view of capacity utilization, sprint forecasting, and workload distribution across every team. You can track buffer consumption, flag over-allocated engineers before a sprint starts, and model delivery dates against actual available hours rather than theoretical headcount. The platform replaces the spreadsheet guesswork that causes most planning failures. If you are ready to plan from real data, explore Teambuilt’s capacity tools and see how it fits your team’s workflow.
FAQ
What is engineering team bandwidth in simple terms?
Engineering team bandwidth is the actual productive time available for planned work after meetings, PTO, on-call duties, and unplanned interruptions are subtracted. It typically represents 50–60% of total contracted hours.
How do you calculate engineering team capacity accurately?
Use average sprint velocity from the last six sprints as your baseline, then subtract known obligations like meetings and planned PTO. Planning to 70–80% of that figure accounts for untracked interruptions.
What affects engineering team bandwidth the most?
Unplanned work is the largest single drain, consuming 20–30% of capacity on most teams. Context switching, on-call rotations, and meeting load are the next biggest factors.
How do i know if my team is over bandwidth?
Consistent sprint carryover, growing backlogs, and rising cycle times are the clearest signals. Tracking WIP count and sprint carryover rate regularly lets you catch stress before it becomes a delivery failure.
What is the optimal engineering team size for bandwidth efficiency?
There is no universal number, but smaller focused teams of 5–8 engineers typically maintain higher bandwidth efficiency than larger groups. Communication overhead scales faster than output as teams grow beyond eight members.
Recommended