
Top metrics to track for effective team planning



TL;DR:
- Effective team planning relies on a small, relevant set of metrics that inform decision-making and avoid analysis paralysis.
- Organizations should focus on actionable, visible, influenceable, and impactful indicators such as utilization rate, throughput, cycle time, and demand versus capacity ratios.
Project managers and operations directors know the feeling: three projects running at once, two engineers already stretched thin, and a stakeholder asking why the last sprint delivered half of what was planned. Without the right metrics, team planning is little more than educated guesswork, and guesswork has a price. Organizations that track targeted performance indicators can move from reactive scrambling to confident, data-driven decisions. This guide breaks down which metrics actually matter, how to compare them, and how to build a planning practice that scales as your team grows.
Table of Contents
- How to select the right team planning metrics
- The essential metrics to track in team planning
- Metric comparison: strengths, weaknesses, and best use
- Making the right metric choices for your team
- Perspective: Why metric obsession can backfire and what actually works
- Level up your team planning with purpose-built tools
- Frequently asked questions
Key Takeaways
| Point | Details |
|---|---|
| Track metrics with purpose | Use metrics that drive action and reflect your team’s context for the best results. |
| Mix flow and effort measures | Combining cycle time, throughput, and effort-based metrics prevents blind spots in planning. |
| Review and adapt regularly | Regularly evaluate and adjust which metrics you use as teams and projects change. |
| Avoid metric overload | Focus on a manageable set of KPIs to encourage insight, not confusion or gaming. |
How to select the right team planning metrics
Not every metric deserves a spot on your dashboard. Adding too many indicators creates noise, and noise leads to analysis paralysis. The goal is to identify the smallest set of measures that gives you the clearest picture of team health, delivery speed, and resource balance.
Start by asking what decisions you need to make on a weekly or monthly basis. If you frequently wrestle with whether to add headcount or redistribute work, utilization and capacity metrics belong front and center. If stakeholders constantly ask about delivery predictability, flow metrics like cycle time matter more. Context shapes everything, and a metric that helps a 10-person startup will not automatically suit a 150-person agency with complex client workflows.
The four criteria that consistently separate useful metrics from noise are:
- Actionability: Can you change something based on this number? If the answer is no, the metric is decorative.
- Visibility: Is the data accessible to everyone who needs it, without manual wrangling?
- Influence: Does the metric reflect something your team actually controls, rather than purely external factors?
- Impact: Does a shift in this number meaningfully affect delivery, cost, or team health?
When evaluating your specific environment, also consider your project types (fixed-scope versus ongoing), team size, the tools already in use, and whether your workflow is iterative or sequential. Familiarizing yourself with foundational project management terms early on makes metric conversations far less confusing across departments.
Key metrics for team planning include resource utilization rate, throughput, cycle time and lead time, velocity for Agile teams, and effort and schedule variance. These cover both the pace of work and the accuracy of estimates, giving you two complementary lenses.
Pro Tip: Start with three to five metrics maximum. Once your team builds a habit of reviewing them consistently, you can expand the dashboard. Adding metrics before the habit is formed usually means the data sits unread.
The essential metrics to track in team planning
With selection criteria established, here is a closer look at the metrics worth tracking, what each one reveals, and where teams commonly go wrong.
-
Resource utilization rate. This is the percentage of available time that team members spend on billable or productive work. A utilization rate above 85% sounds great until you realize that teams running at that level for weeks on end burn out quickly and have no buffer for urgent requests. The sweet spot for most knowledge-work teams sits between 70% and 80%, leaving room for learning, planning, and the inevitable unexpected task. The pitfall is measuring utilization without distinguishing between high-value work and low-value administrative tasks. Tracking hours is not enough; you need to know what those hours produced.
-
Throughput. Throughput counts the number of work items completed in a given period, whether those are tickets, features, or deliverables. Unlike utilization, throughput is output-focused rather than input-focused. A team can be 90% utilized and still have low throughput if members are stuck in meetings or blocked on dependencies. Tracking throughput weekly reveals whether process friction is eating into actual delivery.
-
Cycle time and lead time. Cycle time measures how long it takes to complete a work item once work has actually started. Lead time starts the clock from the moment a request enters the backlog. The gap between the two tells you how long work sits waiting before anyone touches it. If your lead time is three weeks but cycle time is two days, your queue management is the problem, not your team’s speed.
-
Velocity. For Agile teams running sprints, velocity tracks the average number of story points completed per sprint. It is primarily useful for forecasting: if a team consistently delivers 40 points per sprint, you can estimate how many sprints a 200-point backlog will take. The catch, which we will revisit in the comparison section, is that velocity is susceptible to inflation and is not directly comparable across teams.
-
Effort variance. Effort variance compares estimated hours to actual hours spent. A consistent pattern where actuals exceed estimates by 30% signals that estimation practices need work, not necessarily that the team is underperforming. This metric is especially valuable during project post-mortems and when building business cases for resourcing decisions.
-
Schedule variance. Related but distinct from effort variance, schedule variance measures whether deliverables landed on their planned dates. Effort and schedule can diverge: a team might complete a feature within budget hours but still miss the deadline because of dependencies outside their control.
-
Capacity versus demand ratio. This metric compares the work being requested against the team’s actual available capacity. When demand consistently outpaces capacity, you get the slow erosion of morale and quality that often gets misdiagnosed as a “team performance” problem. Reviewing the capacity tracking benefits that organizations see when they make this ratio visible helps build the case for investing in proper tooling.
Resource utilization rate, throughput, cycle time and lead time, velocity, and effort and schedule variance are critical metrics for any team planning to move beyond spreadsheet guesswork. Complementary measures like the capacity versus demand ratio and scheduled versus actual utilization variance add forecasting accuracy that single-view metrics cannot provide on their own.
Teams that invest in structured capacity measurement see measurable gains. Organizations using a team capacity guide as part of their planning process consistently report improvements in sprint predictability and reduction in last-minute resource conflicts.

Pro Tip: Pair at least one effort-based metric (utilization, effort variance) with one flow-based metric (cycle time, throughput). Teams relying on a single approach frequently miss what the other lens would catch, and the blind spots tend to surface at the worst possible time.
Metric comparison: strengths, weaknesses, and best use
After understanding each metric individually, the practical question becomes how to choose among them for your specific team. The table below gives you a fast reference.
| Metric | Strengths | Limitations | Ideal for |
|---|---|---|---|
| Resource utilization rate | Easy to calculate, widely understood | Can incentivize busy-work | All team types |
| Throughput | Output-focused, objective | Ignores item complexity | Agile, Kanban |
| Cycle time | Reveals process bottlenecks | Requires consistent ticket practices | Agile, hybrid |
| Lead time | Shows full customer experience | Can mask internal efficiency | Product, service teams |
| Velocity | Great for sprint forecasting | Easily gamed, not cross-team comparable | Scrum teams |
| Effort variance | Improves estimation accuracy | Requires reliable time tracking | Project-based work |
| Schedule variance | Tracks deadline adherence | External dependencies distort it | Waterfall, fixed-scope |
| Capacity vs. demand ratio | Prevents overload before it happens | Requires forward-looking data | Scaling teams |
“Velocity can be gamed via point inflation; cycle time and throughput provide objective forecasting, for example using the 85th percentile cycle time for commitments. Use both velocity and flow metrics.”
That perspective from practitioners who work with cycle time versus velocity reinforces something most experienced project managers learn the hard way: output metrics that teams control directly tend to drift over time. When velocity is used to evaluate team performance rather than inform planning, story point estimates quietly inflate to meet expectations. Cycle time and throughput, because they are grounded in clock time and item counts rather than abstract points, resist this pattern.
For fast-changing startups where priorities shift weekly, flow metrics like throughput and cycle time give you the most stable signal. Established firms running predictable project-based work often get more value from effort variance and schedule variance because their estimation accuracy directly affects client contracts and revenue forecasting. For story point delivery improvements in Agile environments, combining velocity with cycle time gives you both the narrative stakeholders want and the operational truth your team needs.
If you want to go deeper on predictive accuracy, a solid forecasting guide will show you how to layer probabilistic thinking on top of these metrics so that your delivery dates carry a confidence interval rather than a false sense of precision.
Making the right metric choices for your team
Knowing which metrics exist is only half the challenge. Choosing which ones fit your team requires honest answers to a few guiding questions.
Ask yourself: How many simultaneous projects is the team running? If the answer is more than three per person, capacity versus demand and utilization rate should be non-negotiable. Is your team highly specialized, meaning that one engineer handles all infrastructure work? Then cycle time at the individual level will reveal bottlenecks that aggregate team metrics will hide. Are you running Agile sprints or sequential phases? That answer largely determines whether velocity is relevant or misleading for your context.
Based on your answers, here are practical starting points:
- If your team is Agile and sprint-based, prioritize velocity paired with cycle time and throughput to catch gaming early.
- If your team runs fixed-scope client projects, lead effort variance and schedule variance as your primary indicators.
- If your team is scaling rapidly, make the capacity versus demand ratio your first dashboard item so you can spot overload before it becomes attrition.
- If your team is small and generalist, utilization rate and throughput give you a complete enough picture without overwhelming review sessions.
- If cross-team dependencies frequently delay delivery, lead time (not just cycle time) reveals exactly where handoffs break down.
Once you have selected your initial metrics, set benchmarks based on your own historical data rather than industry averages. Industry benchmarks are useful for context, but your team’s baseline is the only honest comparison point for improvement. Capacity versus demand ratio, scheduled versus actual utilization variance, and effort variance all become significantly more powerful when trended over time rather than read as point-in-time snapshots.
Establish a regular review cadence, monthly at minimum, quarterly for a strategic look at metric relevance. Use planning templates to standardize how your team captures and presents this data so that reviews stay focused on decisions rather than data preparation.
Perspective: Why metric obsession can backfire and what actually works
Here is something most planning guides will not tell you: the teams we see struggle most with resource management are not the ones tracking too few metrics. They are the ones tracking too many, updating dashboards nobody reads, and mistaking activity for insight.
Metrics are diagnostic tools. They are the thermometer, not the cure. When a team’s cycle time spikes, that number does not tell you whether the root cause is unclear requirements, a key person pulled into another project, or a technical problem that took longer than expected. The metric surfaces the symptom; a conversation reveals the cause. This distinction matters because teams that treat dashboards as performance scorecards rather than conversation starters tend to optimize for the number rather than for the outcome the number represents.
Over-measuring creates real harm. When team members know their every hour is tracked against utilization targets, they fill calendars with low-value work to hit the number. When velocity is watched too closely, story point estimates quietly grow. Goodhart’s Law, which states that when a measure becomes a target, it ceases to be a good measure, plays out in resource planning constantly.
The approach that actually works combines a small set of consistent metrics with regular, open team reviews where the story behind the data gets as much attention as the data itself. Optimizing capacity in practice means asking your team what the numbers are telling you collectively, not just reading them from a slide.
Pro Tip: Every quarter, audit your metrics. If a metric has not sparked a meaningful action or insight in the past 90 days, retire it or replace it. A lean dashboard maintained consistently beats a comprehensive one that nobody trusts.
The teams that get the most value from planning metrics are the ones who treat them as a shared language rather than a surveillance system. That shift in framing changes everything about how data is collected, discussed, and acted upon.
Level up your team planning with purpose-built tools
Knowing which metrics to track is a strong start. Actually surfacing them in real time, without spreadsheet maintenance or manual data pulls, is what separates planning teams that execute well from those that stay perpetually behind.
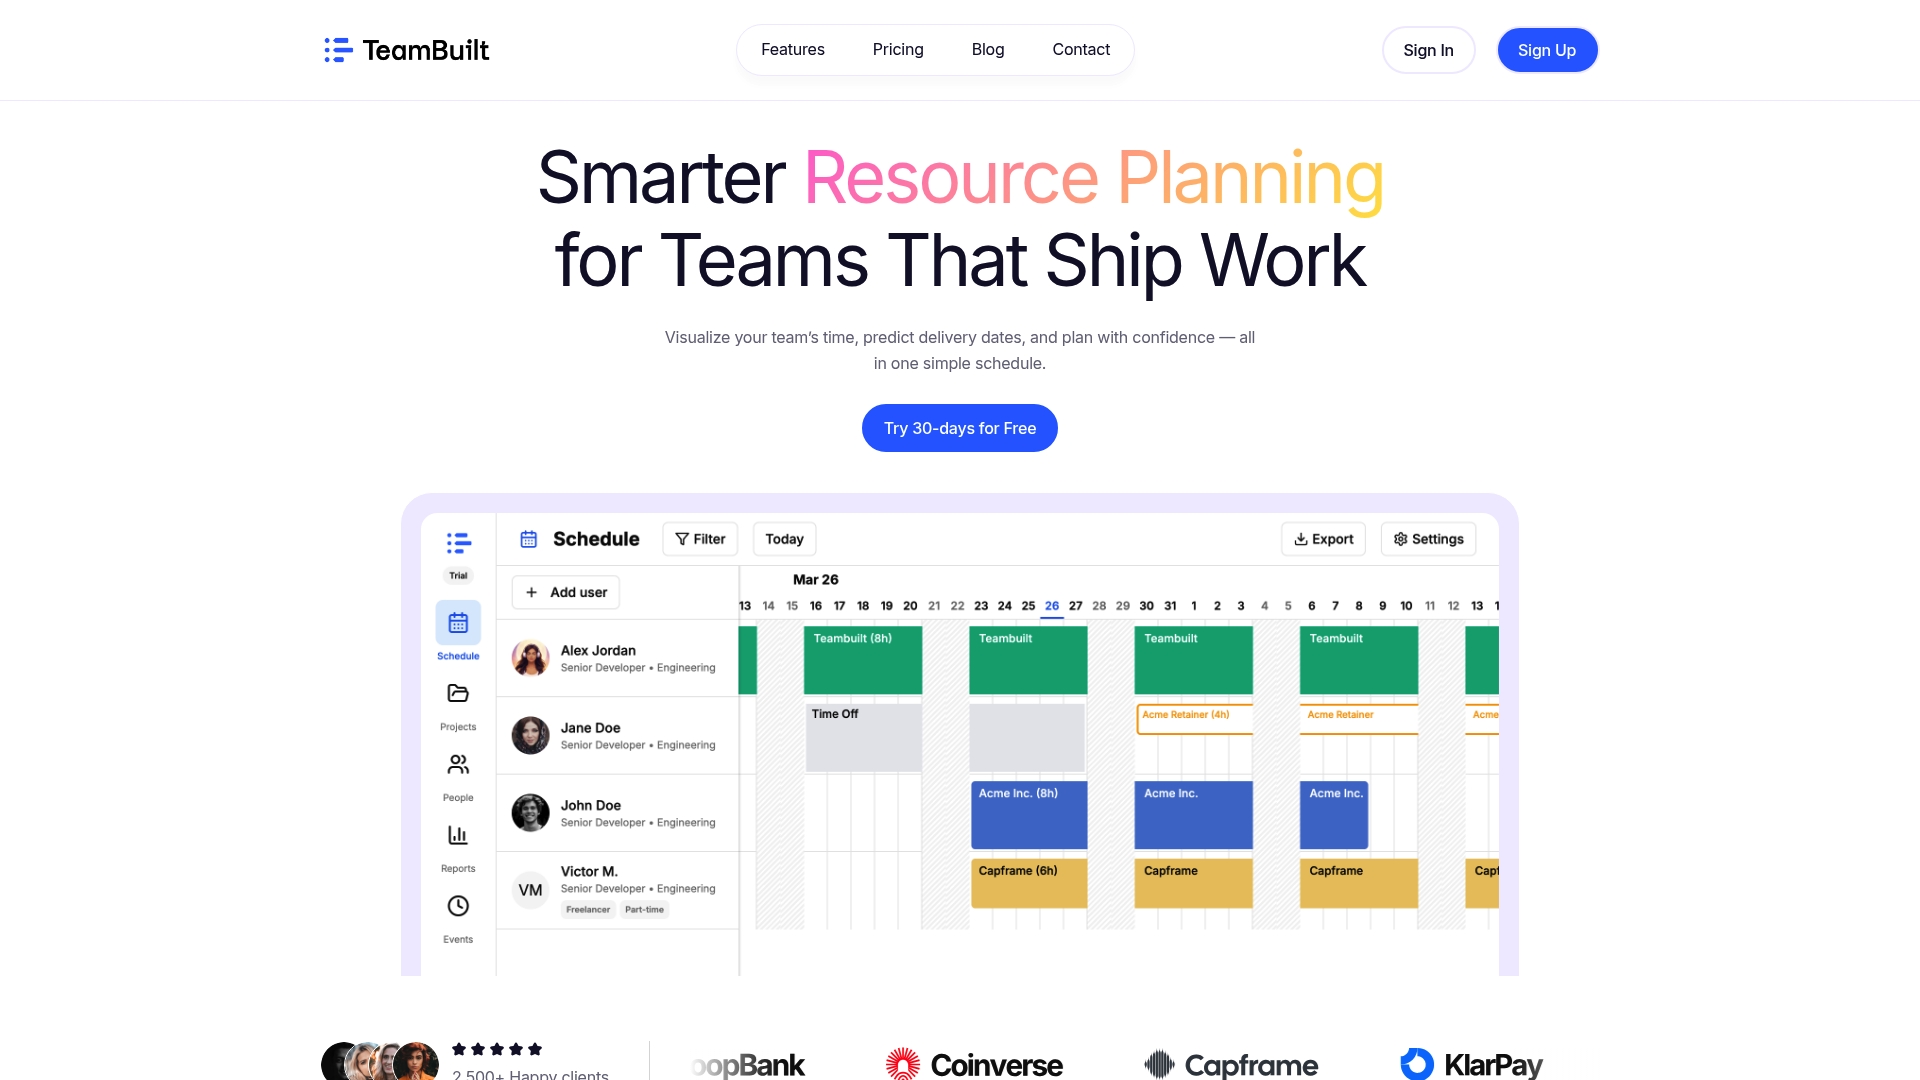
TeamBuilt’s platform brings all of the high-impact metrics covered in this article into a single, real-time view. Utilization rates, capacity versus demand ratios, workload visualization, and delivery forecasts update as your team works, so you are always making decisions on current data rather than last week’s export. With TeamBuilt’s features including cross-team scheduling, workload conflict detection, and open API integrations, you can replace the scattered spreadsheets and disconnected tools that slow planning down. If you are ready to move from reactive firefighting to confident, metric-driven planning, TeamBuilt gives your team the visibility to make it happen.
Frequently asked questions
What is the most important metric for team planning?
No single metric fits every team, but most organizations benefit from starting with resource utilization rate alongside the capacity versus demand ratio, since these two together reveal both current load and future overload risk.
How do I avoid “gaming” metrics like velocity?
Balance output measures like velocity with cycle time and throughput, because gaming velocity through point inflation becomes obvious when flow metrics do not move in the same direction, making inconsistencies easy to spot in review sessions.
How often should teams review their planning metrics?
Teams should review planning metrics at least monthly for operational adjustments and quarterly to evaluate whether the chosen metrics are still driving useful decisions as the team and project types evolve.
What’s the difference between capacity and utilization?
Capacity is the total available output a team can produce in a given period, while utilization measures how much of that capacity is actually being used on planned work at any point in time.
Recommended