
Team performance metrics explained: unlock growth with data

TL;DR:
- Effective team performance metrics should focus on productivity, quality, engagement, communication, and efficiency.
- Leaders must select a few critical, actionable metrics aligned with business goals and review them regularly.
- Using frameworks like KPIs and OKRs together promotes stable monitoring and ambitious growth.
Tracking team performance should give you clarity. Instead, most project managers end up buried in dashboards full of numbers that don’t connect to real decisions. You know something is off, but the data isn’t telling you what to fix or where to focus. The right team performance metrics change that entirely. They cut through the noise, surface what actually drives results, and give your team a shared language for improvement. This article breaks down the metrics that matter, the methodologies that make them actionable, and the pitfalls that quietly derail even well-intentioned teams.
Table of Contents
- What are team performance metrics?
- Essential categories and benchmarks for growing teams
- Methodologies: KPIs, OKRs, and blending both for maximum impact
- Nuances, pitfalls, and expert tips for modern teams
- Our perspective: Why fewer metrics and deeper conversations unlock team growth
- Upgrade your team performance with TeamBuilt
- Frequently asked questions
Key Takeaways
| Point | Details |
|---|---|
| Focus on vital metrics | Track 5-7 meaningful metrics per team to avoid confusion and drive real results. |
| Blend KPIs and OKRs | Combining stable health indicators with stretch goals maximizes team impact. |
| Apply relevant benchmarks | Use proven benchmarks like RPE, utilization, and engagement to measure your progress. |
| Adapt for modern teams | Customize your metrics for hybrid, remote, or small teams to ensure effectiveness. |
| Regular review and action | Review metrics weekly or monthly and tie each discussion to clear action steps. |
What are team performance metrics?
Team performance metrics are specific, measurable indicators that show how well a group is achieving its goals. They’re not just numbers on a report. They’re signals. When chosen well, they tell you where your team is thriving, where it’s stuck, and what to do next.
There are five core categories every growing team should understand:
- Productivity: Task completion rate, cycle time, and throughput. These measure how much work gets done and how fast.
- Quality: Defect rate, rework percentage, and error frequency. These show whether the work is actually good.
- Engagement: Employee Net Promoter Score (eNPS) and retention rate. These reflect how invested your people are.
- Communication: Response times, meeting frequency, and cross-team feedback loops. These reveal how well information flows.
- Efficiency: Utilization rate and revenue per employee (RPE). These connect team output to business impact.
Core team performance metrics include all five of these categories, and the strongest teams track at least one from each. The mistake most managers make is defaulting to productivity metrics alone, which gives you a partial picture at best.
What separates useful metrics from vanity metrics is actionability. A vanity metric looks impressive but doesn’t tell you what to change. For example, tracking total hours logged sounds thorough, but it says nothing about whether those hours produced value. An actionable metric like cycle time (the average time to complete one task) tells you exactly where bottlenecks are forming.
“Choose only a handful of the most critical metrics per team. More metrics rarely means more insight. It usually means more confusion.” This is the consensus among performance experts, and it holds true whether you’re running a five-person startup or a 200-person SMB.
Good metrics also need to align with business impact. If your company’s priority is faster delivery, your metrics should include cycle time and on-time delivery rate, not just customer satisfaction scores. Alignment between what you measure and what the business needs is what makes real-time team coordination actually move the needle. For a deeper look at how teams define and track their most important indicators, team KPI benchmarks offer a solid starting point.
Essential categories and benchmarks for growing teams
With the basics in place, let’s examine which metrics matter most for scaling teams and what numbers signal success.
Here’s a practical reference table for the metrics that matter most in startup and SMB environments:
| Metric | Category | Formula | Benchmark (SaaS/SMB) |
|---|---|---|---|
| Revenue per employee (RPE) | Efficiency | Revenue / Headcount | $300K–$500K |
| Utilization rate | Efficiency | Billable hours / Total hours | 70–90% |
| Net Revenue Retention (NRR) | Growth | (MRR end / MRR start) x 100 | >100% |
| eNPS | Engagement | % Promoters minus % Detractors | >20 |
| Task completion rate | Productivity | Tasks done / Tasks planned x 100 | >85% |
| Defect rate | Quality | Defects / Total output x 100 | <5% |
Typical benchmarks for startups and SMBs show that RPE between $300K and $500K is healthy for SaaS companies, while utilization rates below 70% signal underuse and above 90% signal burnout risk. Both extremes cost you.
Here are the red and green flags to watch for:
- Green: Utilization sits between 75–85%, task completion rate is above 85%, eNPS is positive and trending up.
- Red: Utilization consistently above 90% (burnout incoming), defect rate climbing month over month, eNPS dropping below zero.
- Watch closely: Engagement statistics show that only 23% of employees globally are engaged at work, making eNPS one of the most important leading indicators for any team.
For teams managing multiple projects, connecting these metrics to team capacity planning prevents the common trap of assigning work without knowing if the team can actually absorb it. And when delivery timelines are at stake, tying utilization data to project timeline management gives you a much clearer forecast.

Pro Tip: Don’t chase every metric on this list at once. Pick three to five that directly reflect your current business priority, track them consistently for 60 days, then expand. Clarity comes from focus, not volume.
Methodologies: KPIs, OKRs, and blending both for maximum impact
Understanding core metrics is powerful, but methodologies drive how those numbers fuel action and growth.
Two frameworks dominate team performance management: KPIs and OKRs. They’re often confused or used interchangeably, but they serve very different purposes.
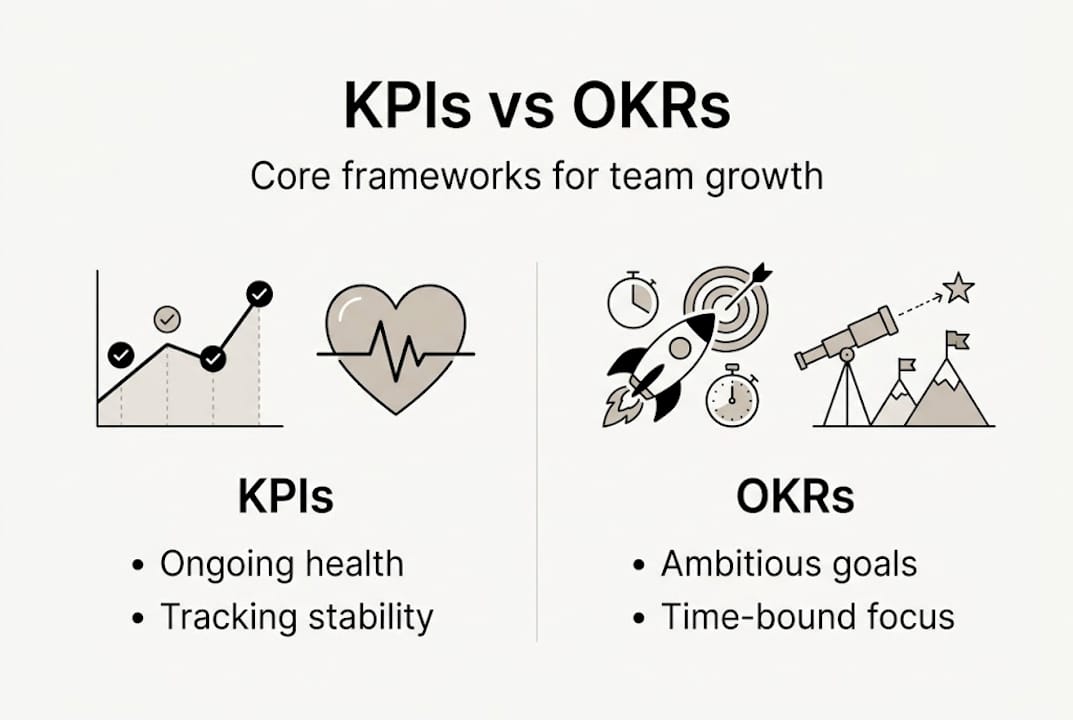
| KPIs | OKRs | |
|---|---|---|
| Purpose | Monitor ongoing health | Drive ambitious improvement |
| Timeframe | Continuous | Quarterly |
| Volume | 8–12 per team | 3–5 per team |
| Best for | Stability, accountability | Growth, alignment, stretch goals |
| Example | Utilization rate >75% | Increase NRR from 95% to 110% by Q3 |
OKRs are for stretch goals, while KPIs monitor stability. Used together, they create both accountability and ambition. Neither works as well in isolation.
Here’s how to blend them effectively:
- Start with KPIs to establish your baseline. Identify where your team consistently underperforms or shows variance.
- Set OKRs around the gaps your KPIs reveal. If utilization is volatile, set an OKR to stabilize it within a target range.
- Review KPIs weekly or biweekly to catch early signals. Review OKR progress monthly to assess trajectory.
- Adjust OKRs at quarter end based on what the KPI data showed throughout the period.
- Kill metrics that don’t drive decisions. If no one acts on a number, it’s wasting attention.
For teams exploring how software can support this, SaaS team empowerment tools make KPI tracking and OKR reviews far less manual. Pairing that with centralized planning tools keeps everyone aligned without requiring endless status meetings.
For a more structured approach to setting OKRs across teams, the OKR playbook provides a practical framework you can adapt immediately.
Pro Tip: Track your OKR achievement rate. If your team hits 100% of OKRs every quarter, the goals aren’t ambitious enough. A 70–75% achievement rate is often the sweet spot for stretch goals that actually push growth.
Nuances, pitfalls, and expert tips for modern teams
Equipped with frameworks, let’s decode the common mistakes and special considerations that trip up even experienced managers.
The most common trap is chasing lagging metrics. A lagging metric tells you what already happened (like quarterly revenue). A leading metric tells you what’s likely to happen (like pipeline activity or utilization trends). Teams that rely only on lagging metrics are always reacting, never anticipating.
Here are the pitfalls to actively avoid:
- Vanity metrics: High page views, total tasks logged, or hours worked look busy but rarely connect to outcomes.
- Metric overload: Tracking 20+ metrics creates analysis paralysis. Teams stop acting and start reporting.
- Ignoring team size: Small teams experience high score variance, meaning one person’s bad week skews every metric. Large teams need more structure to avoid losing individual signal in aggregate data.
- Hybrid team blind spots: Remote and hybrid teams need collaboration charters and dedicated focus time blocks to maintain performance visibility.
Hybrid teams with clear collaboration plans are 66% more engaged and experience significantly less burnout. That’s not a small difference. It’s the gap between a team that functions and one that thrives.
“Healthy teams are two times more likely to outperform their peers. The differentiators are discipline and shared purpose, not team size or budget.” This insight from McKinsey research reinforces something many managers resist: structure and clarity matter more than resources.
For agencies and teams managing complex, overlapping workflows, scalable agency workflows offer a practical model for keeping metrics meaningful without drowning in data.
Pro Tip: Schedule a monthly 30-minute metric review with your team. Not to report numbers, but to ask: “What does this tell us, and what are we doing about it?” That question turns data into action.
Our perspective: Why fewer metrics and deeper conversations unlock team growth
With the landscape of metrics and real-world traps in mind, here’s our candid perspective from working with modern teams.
Most teams don’t fail because they lack data. They fail because they track too much and discuss too little. We’ve seen project managers build elaborate dashboards with 30 metrics, then hold weekly reviews where nobody knows which number to act on. That’s not performance management. That’s performance theater.
The teams that grow fastest share a common pattern: they track five to seven metrics, review them weekly or monthly, and always leave the meeting with a named next step. Not a vague intention. A specific action, owned by a specific person.
Metrics only create value when they spark honest conversations. A utilization rate of 92% isn’t just a number. It’s a signal that someone needs to say, “We’re overloaded, and here’s what we’re going to drop or delay.” Without that conversation, the metric just sits there while the team burns out.
Simplicity is a competitive advantage. When everyone on the team can name the three metrics that matter most this month, alignment happens naturally. You don’t need more team coordination growth insights. You need the right ones, reviewed consistently, with real follow-through.
Upgrade your team performance with TeamBuilt
If you’re ready to put these strategies into action and streamline your metric process, here’s how TeamBuilt can help.
TeamBuilt brings every core metric category into one place, so you’re not stitching together spreadsheets, project tools, and separate analytics platforms. You can track utilization, capacity, and delivery timelines in real time, set up custom dashboards for your KPIs and OKRs, and automate the review cycles that keep your team accountable.
The platform is built for growing startups and SMBs that need structure without bureaucracy. Explore all Teambuilt features and see how resource planning, workload visualization, and cross-team coordination work together in a single workflow. Visit the team analytics platform and start your free trial today.
Frequently asked questions
What are the top 5 team performance metrics for startups?
The five most impactful are task completion rate, defect rate, engagement score, response time, and utilization rate. Core team performance metrics consistently include these across productivity, quality, engagement, communication, and efficiency categories.
How often should teams review performance metrics?
Review metrics every week or month, and always attach a specific action step to each review. Teams that review five to seven metrics on a regular cadence with clear next steps see the strongest performance improvements.
What’s the difference between KPIs and OKRs?
KPIs track ongoing business health and stability, while OKRs set ambitious, time-bound goals for growth. Combining both creates alignment between what you maintain and what you’re actively trying to improve.
How do hybrid or remote teams adjust their performance metrics?
They use collaboration charters and track engagement and focus time as primary indicators. Hybrid teams with structured plans are significantly more engaged and less prone to burnout than those without clear remote work agreements.
What’s a common mistake when tracking team metrics?
The most common mistake is measuring too many metrics or focusing on activity instead of outcomes. Prioritizing five to seven metrics prevents overload and keeps the team focused on what actually drives results.
Recommended