Harness visualization for smarter project planning in 2026


TL;DR:
- Visualization simplifies complex project data into actionable insights, improving resource allocation and risk detection.
- Choosing the right visualization technique depends on project complexity, team size, and specific needs.
- Integrating real-time visual tools into workflows enhances team alignment, decision-making, and project success.
Visualization in project planning is often reduced to a matter of aesthetics, colorful charts that make presentations look polished. That framing misses the real point. When used well, visualization simplifies complex project data into actionable insights that directly improve resource allocation, expose bottlenecks before they become crises, and help your team move faster with far less confusion. For project managers at growing startups and SMBs, that’s not a minor efficiency gain. It’s the difference between delivering on time and scrambling to explain another missed deadline.
Table of Contents
- Why visualization matters in project planning
- Key visualization techniques for project planning
- Matching visualization methods to project needs
- Integrating visualization into planning workflows
- The hidden leverage of visualization: Lessons learned
- Streamline your planning with Teambuilt
- Frequently asked questions
Key Takeaways
| Point | Details |
|---|---|
| Visualization drives clarity | Translating complex data into visuals gives project managers clear, actionable insights for planning. |
| Choose tools strategically | Select visualization methods that match your project’s size, complexity, and workflow for best results. |
| Integration boosts agility | Embedding visualization tools into daily workflows enables faster pivots and more effective collaboration. |
| Beware of common pitfalls | Overly complex or mismatched visuals can hinder, not help, so prioritize clarity and practical fit. |
| The right visuals prevent issues | Effective visualization not only saves time but also uncovers hidden risks and keeps teams motivated. |
Why visualization matters in project planning
Every project generates data. Timelines, task dependencies, team availability, budget status, risk flags. Without a way to see that data clearly and quickly, even experienced project managers make decisions based on incomplete pictures. That’s where visualization earns its place in your toolkit.
Think of visualization as the translation layer between raw information and useful judgment. When you can see which team members are overloaded, which milestones are at risk, and where capacity gaps will open up next sprint, you stop reacting and start leading. Centralized planning tools that surface this information in one shared view are especially valuable for SMBs, where the same person is often managing multiple workstreams at once.
Visualization also plays a quieter but powerful role in team alignment. When everyone is looking at the same dashboard or timeline, there’s less room for competing interpretations of project status. Consensus comes faster. Stakeholder updates become simpler. Teams spend less time in status meetings because the visual already answers most questions.
Here’s what strong visualization delivers in practice:
- Fewer planning errors from missed dependencies or forgotten constraints
- Faster team alignment when priorities shift mid-sprint
- Real-time visibility into resource conflicts before they cause delays
- Clearer communication with stakeholders who don’t live in the details
- Reduced cognitive load for project managers tracking complex workflows
Following data visualization best practices isn’t about making things look nice. It’s about designing views that surface the right information at the right moment.
“Good visualization doesn’t just show you where you are. It shows you where you’re headed and what’s in the way.”
For startups in particular, where plans change fast and teams are lean, a clear visual overview can be the difference between an agile pivot and a chaotic scramble. The goal is always clarity that drives action, not decoration that signals effort.
Key visualization techniques for project planning
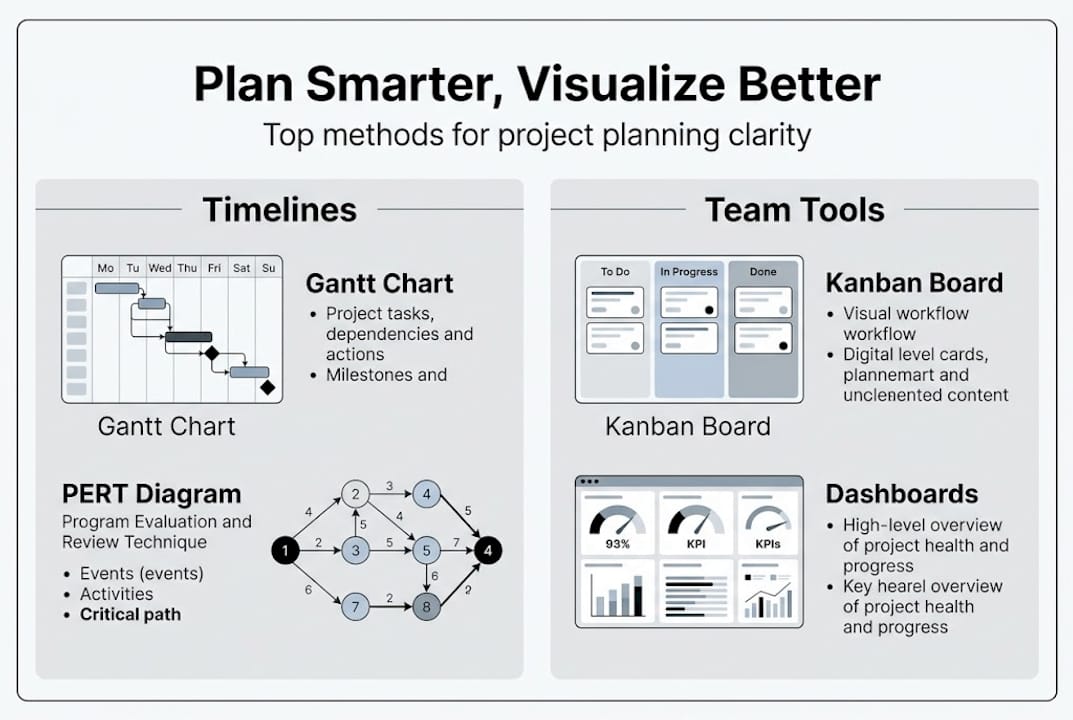
Not all visualization tools are built for the same job. Key methodologies include Gantt charts for timelines and dependencies, Kanban boards for agile workflows, Precedence Diagramming Method (PDM) for mapping task relationships, and resource histograms for tracking allocation across your team. Each one excels in specific contexts, and knowing the difference saves you from applying the wrong tool to the wrong problem.
Here’s a quick comparison to orient your selection:
| Technique | Best for | Weakness |
|---|---|---|
| Gantt chart | Timeline tracking, dependencies | Weak cross-project workload view |
| Kanban board | Agile, flexible task management | Less useful for fixed-date projects |
| PDM (network diagram) | Mapping complex task relationships | Overkill for simple projects |
| Resource histogram | Capacity and utilization tracking | Can be hard to read at scale |
Selecting the right technique is a process, not a guess. Here’s a simple approach to guide your decision:
- Define the primary question you need the visual to answer (timeline, capacity, flow, or dependencies).
- Assess your project’s complexity and whether tasks are fixed or fluid.
- Consider your team’s familiarity with each method to reduce onboarding friction.
- Start with one technique and layer in a second only when the first leaves gaps.
Many teams use project management tools for SMBs that support multiple visualization formats, which makes it easier to switch between views as a project progresses. You might rely on a Kanban board during sprint planning and then shift to a Gantt chart when locking in delivery dates for stakeholders.
Pro Tip: For large, complex projects, use PERT or PDM during the planning phase to map every dependency clearly, then switch to a Gantt chart once execution begins. This combination keeps planning rigorous and execution visible. Reviewing SMB workflow examples from similar organizations can give you a practical model to build from.
Matching visualization methods to project needs
Choosing a visualization technique isn’t just about preference. The wrong choice can add confusion instead of clarity. Stacked charts are hard for large teams or when exact values matter; Gantt charts miss the cross-project workload picture; PDM gets complex fast when applied to straightforward projects. Matching the tool to the actual scenario is the critical step most teams skip.
Here’s a practical reference for aligning technique to project type:
| Project type | Recommended technique | Avoid |
|---|---|---|
| Short-cycle agile sprints | Kanban board | PDM, complex Gantt |
| Multi-phase product launch | Gantt chart + milestones | Stacked charts |
| Complex dependency mapping | PDM / network diagram | Kanban alone |
| Resource-heavy operations | Resource histogram | Timeline-only Gantt |
Beyond project type, team structure matters. A small startup team of five will drown in a PDM built for a 30-person enterprise rollout. An agency running six client projects simultaneously needs a view that shows cross-project capacity, not just individual task status. Looking at agency project workflows can clarify what multi-client visualization setups actually look like in practice.
Common mistakes to avoid when selecting your visualization method:
- Choosing a tool because it’s familiar, not because it fits the project
- Over-engineering visuals with too many layers, colors, or data points
- Ignoring team input when rolling out a new visualization standard
- Treating visualization as a one-time setup rather than a living document
Pro Tip: Clarity beats ornamentation every time. If your visualization requires a legend longer than five items or a five-minute explanation before a meeting, it’s doing more harm than good. The best visual is the one your whole team actually reads and uses without being asked.
For PDM details and when this method genuinely adds value versus when it slows teams down, it’s worth understanding the mechanics before adopting it broadly.
Integrating visualization into planning workflows
A visualization tool that lives in a slide deck and gets updated once a month isn’t doing its job. The real value comes when visualization is woven into how your team plans, reviews, and adjusts on a weekly and even daily basis.

Real-time dashboards and Kanban enable agile adjustments that improve collaboration and reduce stress in fast-paced environments. But getting there requires deliberate workflow design, not just installing new software.
Best practices for embedding visualization into your planning cycle:
- Assign a visualization owner for each project who keeps the view updated and accurate
- Review the primary visual at the start of every sprint or weekly planning session
- Use dashboards as a shared reference during standups, not just in formal reviews
- Set a clear protocol for updating the visual when scope, timeline, or resources change
- Audit your visualization setup every quarter to remove noise and add relevant metrics
Accountability increases when the visual is shared. When your team can see task ownership, capacity load, and deadlines in one place, people take more responsibility because the picture is transparent. Explore real-time collaboration strategies for structuring team reviews around shared visual data.
“Visualization that isn’t connected to your actual workflow is just wallpaper. It has to be the thing your team looks at before making any resource or priority decision.”
One common pitfall is treating visualization as a reporting tool rather than a planning tool. Reports tell you what happened. Visualizations, when integrated properly, tell you what’s about to happen and give you time to course-correct. Pairing your planning visual with team scheduling optimization practices ensures the two systems reinforce each other rather than creating duplicate work.
The hidden leverage of visualization: Lessons learned
Most articles focus on the obvious wins from visualization: faster status updates, fewer planning errors, cleaner handoffs. Those gains are real. But the deeper value is often invisible until you’ve lived it.
Clear visuals reduce the kind of chronic low-grade anxiety that affects teams managing too much information with too little structure. When people can see the plan, they trust the plan. That trust reduces second-guessing, lowers the number of check-in requests, and creates space for teams to focus on execution rather than interpretation. In dynamic team environments, where roles shift and priorities evolve fast, that psychological clarity is genuinely valuable.
Visualization also surfaces risks that would otherwise stay invisible until they become emergencies. A resource histogram showing one engineer at 140% capacity isn’t just a scheduling problem. It’s an early warning for burnout, quality issues, and timeline slippage. Seeing it early gives you options. Missing it until the sprint breaks does not.
The honest lesson is this: most teams underinvest in visualization not because they don’t value clarity, but because setting it up well takes discipline upfront. That investment pays back quickly and keeps paying.
Streamline your planning with Teambuilt
If you’ve been managing projects through spreadsheets, scattered status emails, or disconnected tools, you already know the cost. Missed capacity signals, outdated timelines, and resource conflicts that nobody saw coming until they hit.
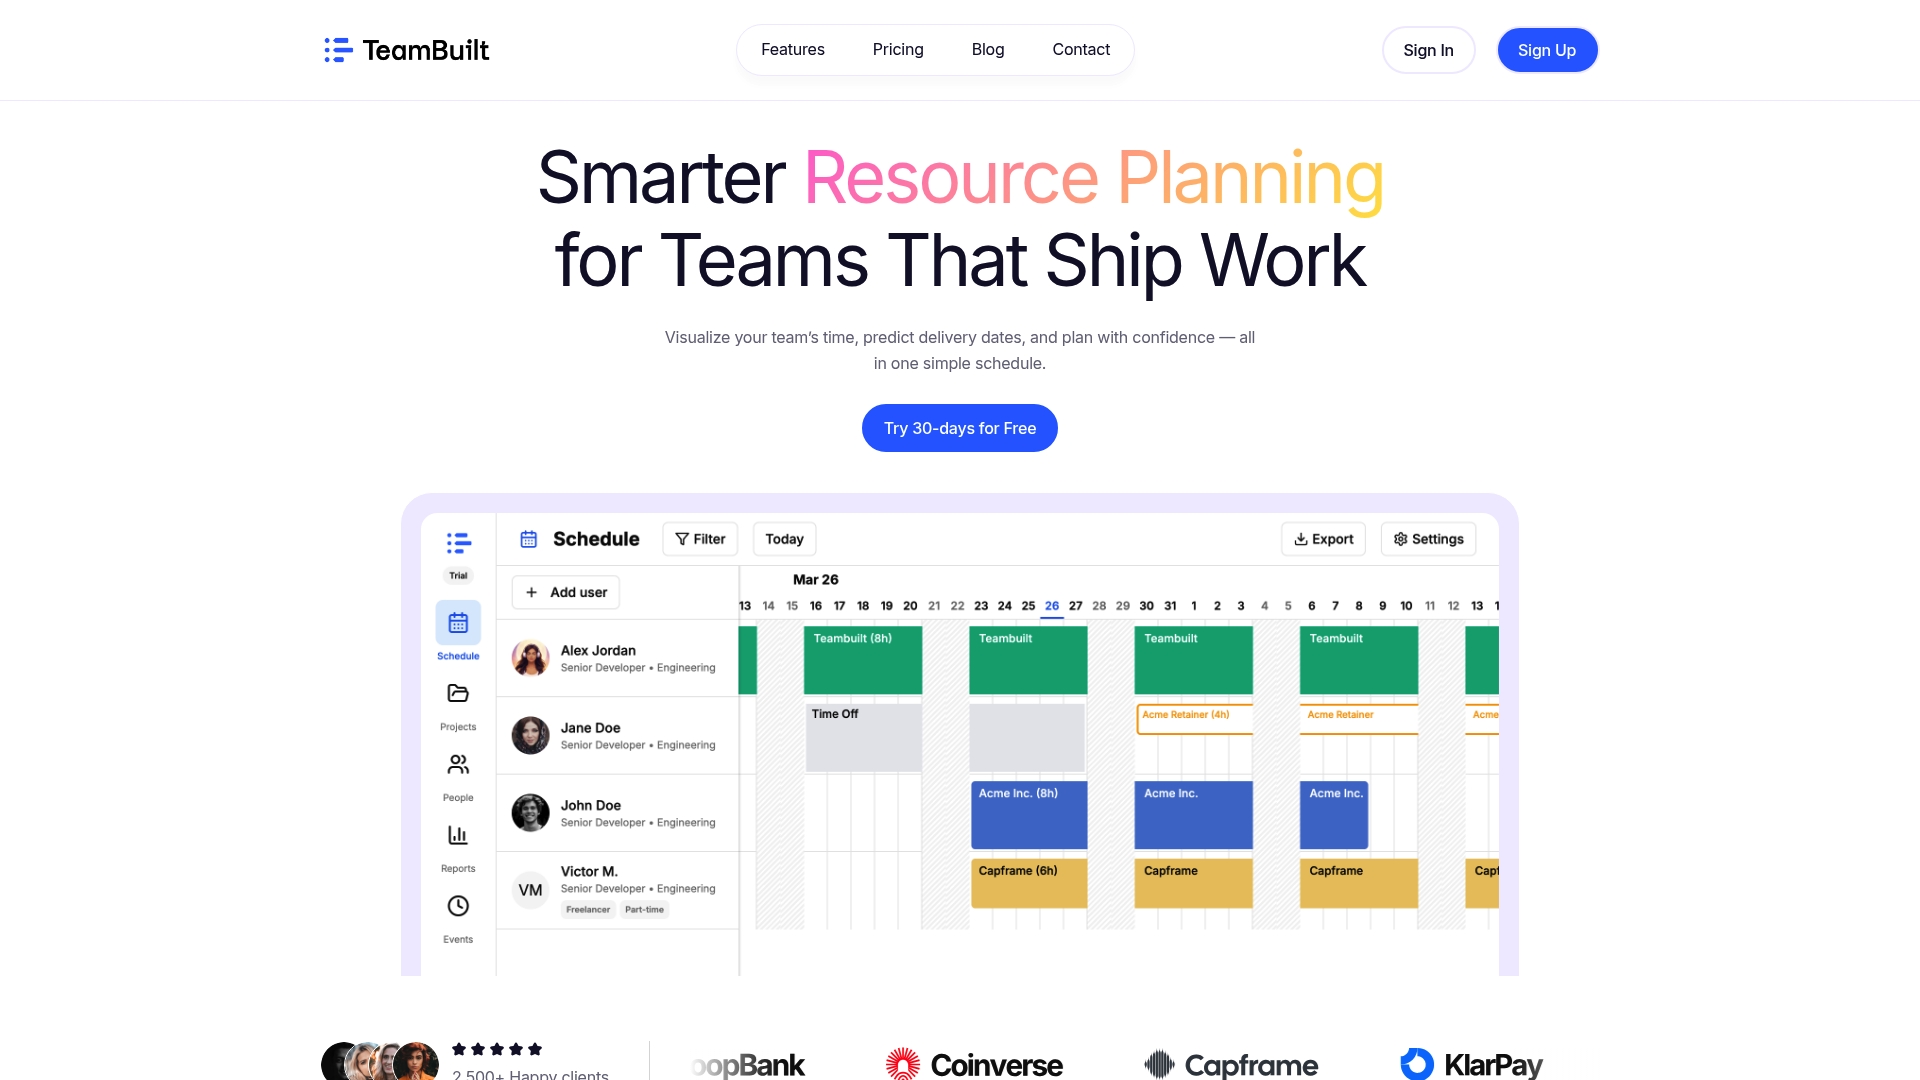
Teambuilt is built specifically for project managers and team leaders at growing startups and SMBs who need real-time visibility into workload, capacity, and project timelines without the overhead of enterprise software. From visual workload management to forecasting delivery dates based on actual resource availability, the resource planning features are designed to replace the guesswork with clarity. If the techniques in this guide resonated, Teambuilt gives you the infrastructure to apply them consistently and at scale.
Frequently asked questions
What is the main benefit of using visualization in project planning?
Visualization turns complex project data into clear, actionable insights, helping project managers make faster decisions and allocate resources more effectively across teams.
Which visualization tools are best for agile project management?
Kanban boards and real-time dashboards are the strongest fit for agile teams, supporting rapid workflow adjustments and transparent task tracking across sprints.
How do I choose the right visualization method for my project?
Match the tool to project size and complexity. Gantt charts work well for timeline-driven work, Kanban suits flexible task flows, and PDM is best when mapping task dependencies across a complex project structure.
Can combining visualization methods improve results?
Yes. Pairing PERT or PDM during planning with Gantt charts during execution can reduce planning time significantly and prevent delays by maintaining both structural rigor and execution visibility.
Recommended